
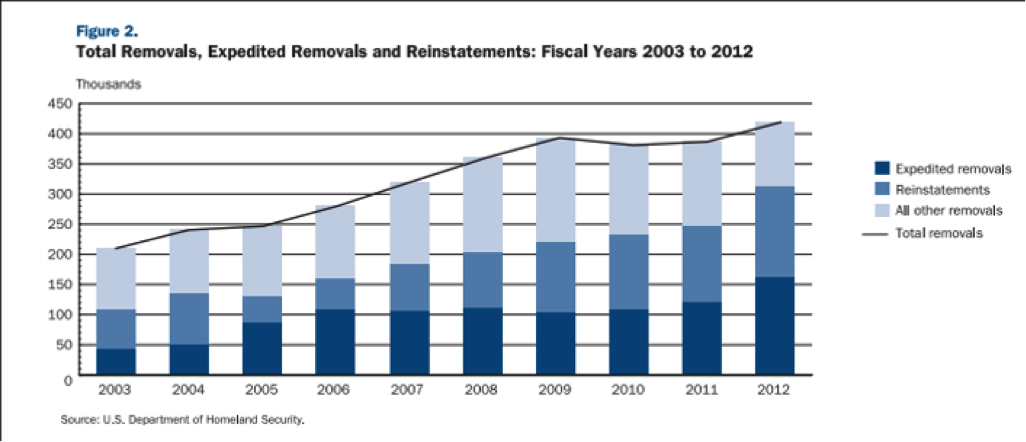
Statistics
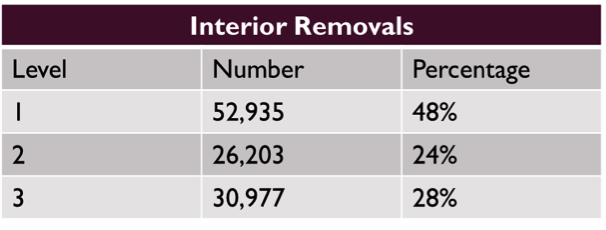
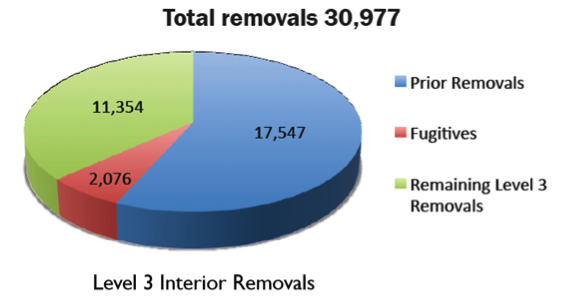
In the fiscal year of 2013, there were a total of 368,644 deportations. 59% of these removals were of convicted criminals, and 133,551 of the total deportations occurred within the country’s borders. Out of all of the interior removals, 30,977 were level three removals, meaning those deported were convicted of less than three misdemeanors. These numbers include immigrants who might have been eligible for the DREAM Act.
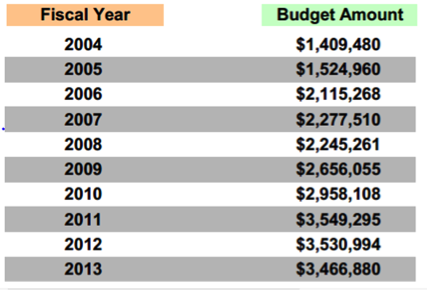
Border security costs by year:
Deportations by level:
•Level I: convicted of two or more felonies
•Level 2: convicted one felony or three or more misdemeanors
•Level 3: convicted of less than three misdemeanors
Between 2010 and 2011, 422,000 immigrants entered the United States. 56,384 of those immigrants were refugees coming for a better life away from other foreign governments.
11.1% of Virginian residents are foreign-born.
Virginia’s foreign-born population grew from one in 100 in 1970 to one in nine in 2012.
17 states legalized public and in-state tuition funds to undocumented students: California, Colorado, Connecticut, Illinois, Kansas, Maryland, Minnesota, Nebraska, New Jersey, New Mexico, New York, Oregon, Texas, Utah, Washington, Oklahoma, and Rhode Island.
According to the Alliance for Excellent Education, each year, 1.2 million students drop out of high school. Over half of America's dropouts are from minority groups. Since dropouts earn significantly less than their classmates who receive high school diplomas, the cost of lost wages is significant. Throughout their lives, the dropouts from 2008 alone will cost states $319 billion in lost wages. Because immigrants may not qualify for lower rates of tuition, these statistics relate to the education of foreign-born students.